sourceMTR – A Network Diagnostic Tool for Linux
Download Your Free eBooks NOW - 10 Free Linux eBooks for Administrators | 4 Free Shell Scripting eBooks
MTR is a simple, cross-platform command-line network diagnostic tool that combines the functionality of commonly used traceroute and ping programs into a single tool. In a similar fashion as traceroute, mtr prints information about the route that packets take from the host on which mtr is run to a user specified destination host. Read Also: How to Audit Network Performance, Security and Troubleshoot in Linux However, mtr shows a wealth of information than traceroute: it determines the pathway to a remote machine while printing response percentage as well as response times of all network hops in the internet route between the local system and a remote machines. How Does MTR Work?Once you run mtr, it probes the network connection between the local system and a remote host that you have specified. It first establishes the address of each network hop (bridges, routers and gateways etc.) between the hosts, it then pings (sends a sequence ICMP ECHO requests to) each one to determine the quality of the link to each machine. During the course of this operation, mtr outputs some useful statistics about each machine – updated in real-time, by default. This tool comes pre-installed on most Linux distributions and is fairly easy to use once you go through the 10 mtr command examples for network diagnostics in Linux, explained below. If mtr not installed, you can install it on your respective Linux distributions using your default package manager as shown. $ sudo apt install mtr $ sudo yum install mtr $ sudo dnf install mtr 10 MTR Network Diagnostics Tool Usage Examples1. The simplest example of using mtr is to provide the domain name or IP address of the remote machine as an argument, for example google.com or 216.58.223.78. This command will show you a traceroute report updated in real-time, until you exit the program (by pressing $ mtr google.com OR $ mtr 216.58.223.78 Start: Thu Jun 28 12:10:13 2018 HOST: TecMint Loss% Snt Last Avg Best Wrst StDev 1.|-- 192.168.0.1 0.0% 5 0.3 0.3 0.3 0.4 0.0 2.|-- 5.5.5.211 0.0% 5 0.7 0.9 0.7 1.3 0.0 3.|-- 209.snat-111-91-120.hns.n 80.0% 5 7.1 7.1 7.1 7.1 0.0 4.|-- 72.14.194.226 0.0% 5 1.9 2.9 1.9 4.4 1.1 5.|-- 108.170.248.161 0.0% 5 2.9 3.5 2.0 4.3 0.7 6.|-- 216.239.62.237 0.0% 5 3.0 6.2 2.9 18.3 6.7 7.|-- bom05s12-in-f14.1e100.net 0.0% 5 2.1 2.4 2.0 3.8 0.5 2. You can force mtr to display numeric IP addresses instead of host names (typically FQDNs – Fully Qualified Domain Names), using the $ mtr -n google.com Start: Thu Jun 28 12:12:58 2018 HOST: TecMint Loss% Snt Last Avg Best Wrst StDev 1.|-- 192.168.0.1 0.0% 5 0.3 0.3 0.3 0.4 0.0 2.|-- 5.5.5.211 0.0% 5 0.9 0.9 0.8 1.1 0.0 3.|-- ??? 100.0 5 0.0 0.0 0.0 0.0 0.0 4.|-- 72.14.194.226 0.0% 5 2.0 2.0 1.9 2.0 0.0 5.|-- 108.170.248.161 0.0% 5 2.3 2.3 2.2 2.4 0.0 6.|-- 216.239.62.237 0.0% 5 3.0 3.2 3.0 3.3 0.0 7.|-- 172.217.160.174 0.0% 5 3.7 3.6 2.0 5.3 1.4 3. If you would like mtr to display both host names as well as numeric IP numbers use the $ mtr -b google.com Start: Thu Jun 28 12:14:36 2018 HOST: TecMint Loss% Snt Last Avg Best Wrst StDev 1.|-- 192.168.0.1 0.0% 5 0.3 0.3 0.3 0.4 0.0 2.|-- 5.5.5.211 0.0% 5 0.7 0.8 0.6 1.0 0.0 3.|-- 209.snat-111-91-120.hns.n 0.0% 5 1.4 1.6 1.3 2.1 0.0 4.|-- 72.14.194.226 0.0% 5 1.8 2.1 1.8 2.6 0.0 5.|-- 108.170.248.209 0.0% 5 2.0 1.9 1.8 2.0 0.0 6.|-- 216.239.56.115 0.0% 5 2.4 2.7 2.4 2.9 0.0 7.|-- bom07s15-in-f14.1e100.net 0.0% 5 3.7 2.2 1.7 3.7 0.9 4. To limit the number of pings to a specific value and exit mtr after those pings, use the $ mtr -c5 google.com 5. You can set it into report mode using the $ mtr -r -c 5 google.com >mtr-report The $ mtr -rw -c 5 google.com >mtr-report 6. You can also re-arrange the output fields the way you wish, this is made possible by the $ mtr -o "LSDR NBAW JMXI" 216.58.223.78 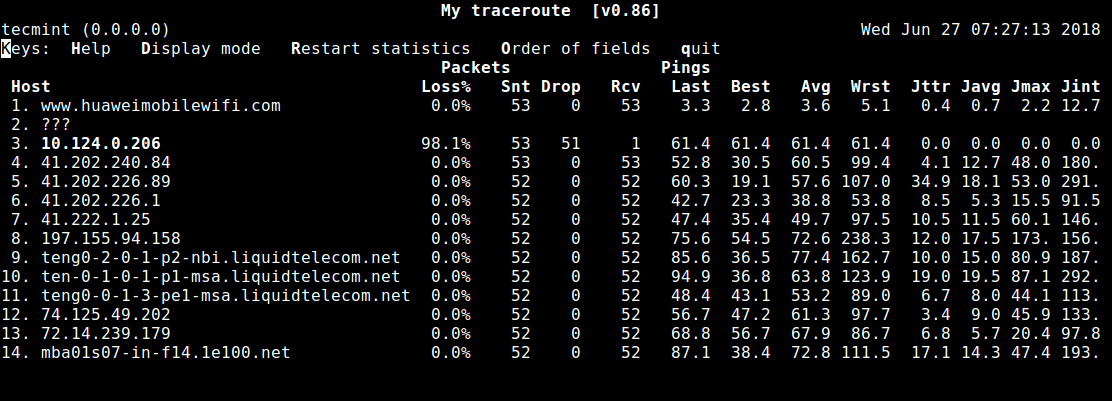
MTR Fields and Order 7. The default interval between ICMP ECHO requests is one second, you can specify interval between ICMP ECHO requests by changing the value using the $ mtr -i 2 google.com 8. You can use TCP SYN packets or UDP datagrams instead of the default ICMP ECHO requests as shown. $ mtr --tcp test.com OR $ mtr --udp test.com 9. To specify the maximum number of hops (default is 30) to be probed between the local system and the remote machine, use the $ mtr -m 35 216.58.223.78 10. While probing network quality, you can set the packet size used in bytes using the $ mtr -r -s PACKETSIZE -c 5 google.com >mtr-report With these examples, you should be good to go with using mtr, see man page for more usage options. $ man mtr Also check out these useful guides about Linux network configurations and troubleshooting:
That’s it for now! MTR is a simple, easy-to-use and above all cross-platform network diagnostics tool. In this guide, we have explained 10 mtr command examples in Linux. If you have any questions, or thoughts to share with us, use the comment form below.
0 Comments
Leave a Reply. |
Archives
March 2024
Categories
All
|

 RSS Feed
